Weave

The weave visualisation is a simple and clean static representation of a sorting algorithm. The width is fixed, so the X-axis does not tell us anything of the complexity or performance of the algorithm. The original blogpost describes the motivations and aims of the weave visualisations in detail.
Dense

The dense visualisations use a Hilbert-ordering of the RGB colour cube to show the workings of sorting algorithms on a larger scale. The pixel-width is equal to the number of "steps" taken to sort the sequence - each step is a transposition of two elements in the list of numbers being sorted.
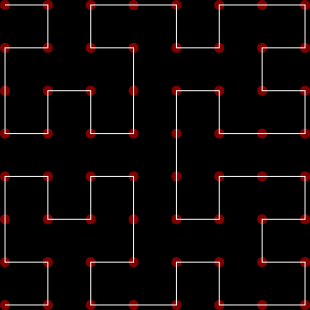
The most interesting aspect of this visualisation is the way the order of the sorted colours are chosen. We would like to choose a sorted sequence of colours where similar colours are as close to each other as possible. This turns out to be a tricky problem, with a clever mathematical solution. The Hilbert curve is a remarkable space-filling curve that has found wide use in in computer science precisely because it has good clustering properties.

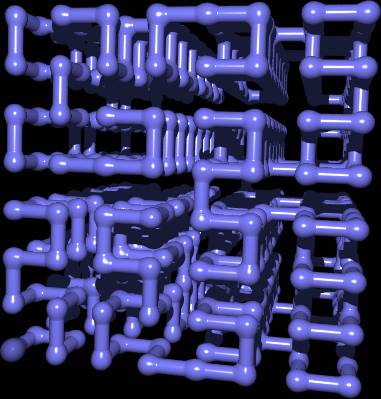
If we take a curve like the one above and straighten it out, points that are close together in the two-dimensional layout will also tend to be close together in the linear sequence. I say "tend to be", because we can never get this perfectly right - we can show that any curve of this type will have some points that are close to each other spatially but far from each other on the curve. , however, that the clustering behaviour of the Hilbert curve is almost as good as we can currently get. The Hilbert curve can be generalized to any number of dimensions - here's the 3-dimensional Hilbert curve of order 3:

If we imagine the RGB colour space as a cube like the one above, where every colour is uniquely identified by a set of (r, g, b) co-ordinates, then the Hilbert order traversal of the colour cube will give us a one-dimensional ordering of the colours that has nearly optimal colour locality preservation - which is exactly what we want. The sequence of colours produced looks like this:

If we assume that close to each other in the colour cube are visually similar, then the ordering above should be just about as good as we can get.
There are a number of posts on my blog that explore Hilbert-curve based visualisations in more detail - Portrait of the Hilbert curve, and a later post applying the idea to sorting algorithms.
Copyright 2010 Aldo Cortesi